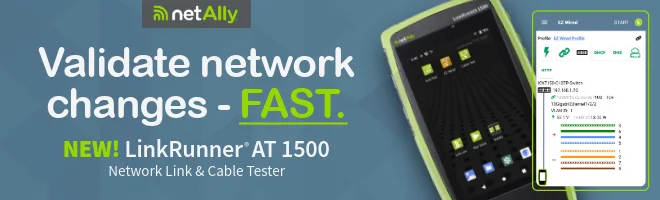
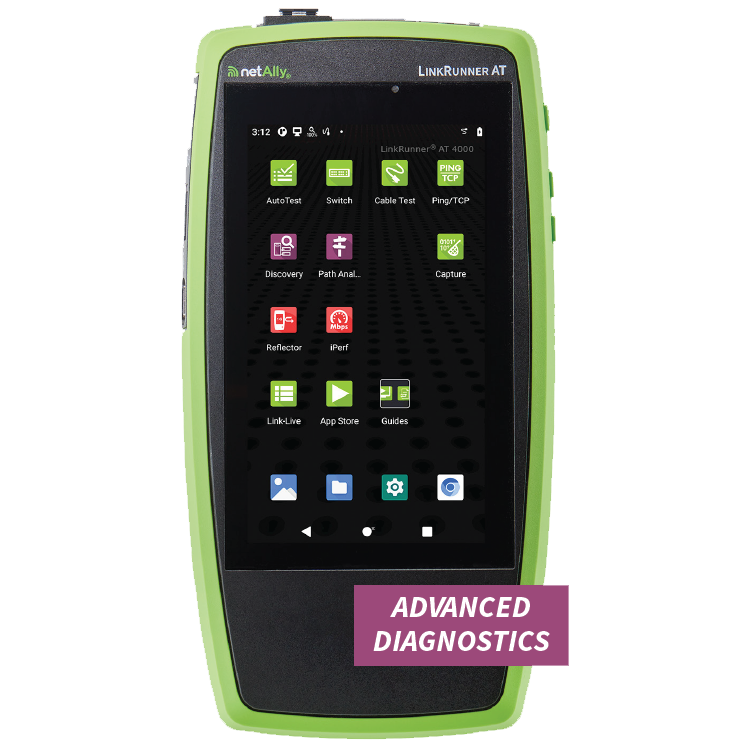
Tycom and NetAlly Introduce a Powerful, Affordable Tool for Frontline Network Professionals
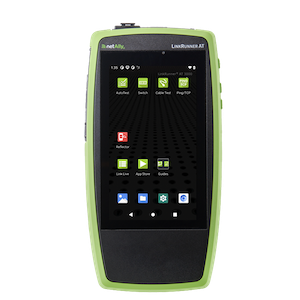
Randburg – Tycom (www.tycom.co.za), in partnership with NetAlly, proudly announces the launch of the LinkRunner AT 1500 Link & Cable Auto Tester—a next-generation solution designed to simplify and accelerate network validation, troubleshooting, and installation.
As organisations expand their digital infrastructure to support all network devices, IoT, smart environments, and multi-gigabit networks, the need for fast, accurate, and reliable testing tools has never been greater. The LinkRunner AT 1500 empowers frontline technicians and low-voltage installers to validate network connectivity in seconds—transforming complex troubleshooting into a streamlined, one-button process.
“The affordability of the LinkRunner AT 1500 is a game-changer for network teams. It reduces diagnostic time from hours to minutes, enabling faster resolutions, improved collaboration, and ultimately stronger business efficiencies” says Ty Barnes CEO of Tycom.
Introduction to AirMapper Wifi EcoSystem by NetAlly
The AirMapper WiFi Ecosystem By NetAlly is a suite of interoperable products that speed and simplify wired and Wi-Fi network planning, installation, validation, and troubleshooting. NetAlly is the first to offer site survey data collection and network discovery in powerful handheld instruments, with complete infrastructure and heat mapping in the Link-Live™ collaboration, reporting, and analysis plaform or AirMagnet® Survey PRO.
With the AirMapper Ecosystem, your team can design a Wi-Fi network with AirMagnet Survey PRO, quickly perform a validation site survey using the AirMapper app on the AirCheck® G3, EtherScope® nXG, or CyberScope® and easily collaborate through the use of the Link-Live.
Using NetAlly’s Wifi Survey Handheld Tools
Wifi Site survey and complete Wi-Fi or Bluetooth analysis in the palm of your hand – no laptop, no dongle, and no tethered device
Provides accurate and complete heat maps by measuring performance from the perspective of other mobile devices.
Can perform WiFi (active and passive) and Bluetooth surveys on a single walkthrough.
Globally, solar installations (also known as photovoltaic or PV installations) are continuing to multiply rapidly, driven by compelling economics for utility-scale solar generation and efforts to decarbonize the grid. As solar distribution systems and loads become larger and more complex, the possibilities of transient overvoltages increase — and the implications for safety become more important than ever.
When you’re taking measurements on solar installations, these transients are invisible and largely unavoidable hazards, which means that your protection depends on the safety margins already built into your tools. That’s where the Measurement Category Rating comes in: it’s designed to tell the user which types of electrical installations the measurement device may safely make measurements in.
This article by Tony Fortunato helps you get a feel for how useful the LRAT-4000 is for managing your camera surveillance network.
Using the LinkRunner AT 4000 for Surveillance Video Camera Installation
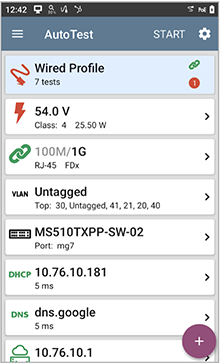
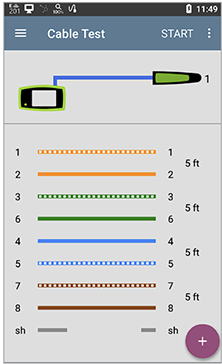
Tony Fortunato: I’m a big believer when it comes to hand held diagnostic tools, in that they should have several key features that can help you identify, validate, and report statistics to you. Some common tools a network engineer has in their toolbox is a network cable tester, primarily used for testing network cable termination. These tools are great when you’re trying to perform a quick check to see if a network cable is terminated properly. And that right there is the issue– it’s a quick check and not a complete comprehensive network cable test, validation, and reporting tool.
Let’s discuss what is critical for network situational awareness and why it is important.
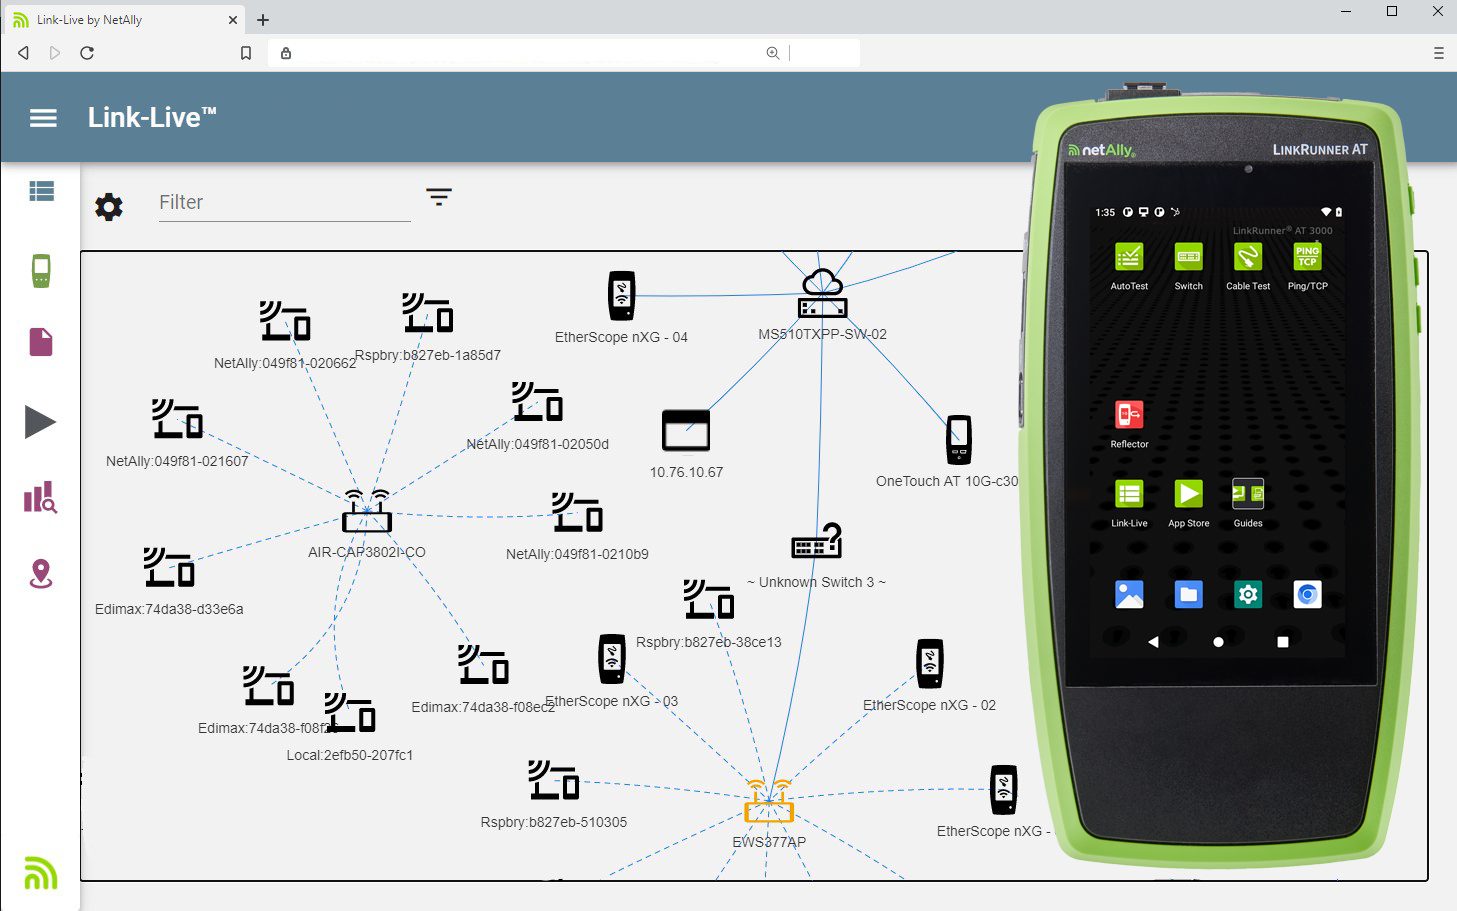
The powerful dashboards, tables and reports Link-Live can provide help with team collaboration of how the network is configured and what vulnerabilities may be hiding in the edge, data centre or cloud. This in combination with NetAlly CyberScope gives your team true situational awareness anywhere in the network.
The Need for Situational Awareness
There are many definitions of situational awareness. Here’s one from Wikipedia:
Situational awareness or situation awareness (SA) is the understanding of an environment, its elements, and how it changes with respect to time or other factors. Situational awareness is important for effective decision making in many environments.
Given this definition and the many “moving parts” of the perimeter network, detailed situational awareness at the edge is a “must-have” to achieving peak customer satisfaction and maintaining a robust cybersecurity posture. Why is this so? Because ultimately the edge is the “face” of IT resources where most users connect. It’s also ground zero for the proliferation of devices such as IT, IoT, and other unmanaged endpoints. So many devices being connected and removed, employees, customers, and visitors—friend and potentially foes—joining and leaving the network continuously. Constant changes to the network resources to support all this makes for a chaotic environment from both a performance and cybersecurity perspective.
Hence, ensuring easy and comprehensive visibility for all stakeholders whether NetOps, SecOps is a must. That’s where Link-Live makes the process simple. With tight integration of NetAlly handheld tools such as CyberScope®, EtherScope® nXG, and AirCheck® G3 Pro, field data spanning the entire organization’s locations can be easily uploaded and shared from one central location. Then, anyone with a need and authorization can be given their own login and instantly get a snapshot of status via intuitive summary browser-based dashboards —with drill down details for those who want to dig deep.
Four Key Elements to Edge Situational Awareness
Situational awareness at the edge is crucial for maintaining security, performance, and operational efficiency. There are numerous elements to achieving maximum situational awareness at the perimeter. Here we will highlight four:
Device Health, Availability, and Status – Ensuring endpoints are consistently operating properly demands ongoing monitoring. Depending on the application or function it supports, validation of device availability can also be an integral part of operational health (e.g., IoT sensors used in healthcare or manufacturing processes) and customer satisfaction.
Network Topology Intelligence – Knowing the layout and structure of the edge network is key to quickly addressing failures and rerouting traffic. It’s also crucial for quickly detecting unauthorized changes that might otherwise be missed for an extended period, so periodically updating topology maps and comparing with previous versions is essential.
Infrastructure Integrity – Certifying only approved network components are attached to and operational is another indispensable element in edge situational awareness efficacy. Just say “no” to rogue network equipment. With NetAlly, users can categorize devices into four authorization classes: Authorized, Unauthorized, Neighbor, or Unknown. This makes the process of finding new devices fast. Here too is the need to confirm correct configuration, including things such as network segmentation and provisioning along with a various wireless parameter such as channel usage, manufacturing prefixes, and 802.11/security types.
Threat Detection and Security Monitoring – Edge networks are often the first line of defense and with their elevated attack surface and easy accessibility a prime target of hackers, so it’s crucial to detect vulnerabilities early before they can be exploited.
Combined Edge Network and Security Visibility is Crucial
As can be seen in the four elements discussed above, the path to peak edge visibility and therefore optimal operational integrity entails the blending of parameters that span the historical knowledge domain areas of security and network teams. Having only one perspective leaves major potential gaps in network perimeter health, status, and worst of all security. The solution? Convergence (or at least cooperation) of edge network and security operational data and intelligence. This does not require teams combine, but it does mean acknowledging NetOps and SecOps each brings distinct, but frequently overlapping areas of excellence that when united offer tremendous upside for the entire organization. The right tool can facilitate this important initiative. NetAlly Link-Live is that tool.
Bridge the Network and Security Teams Gap with Link-Live
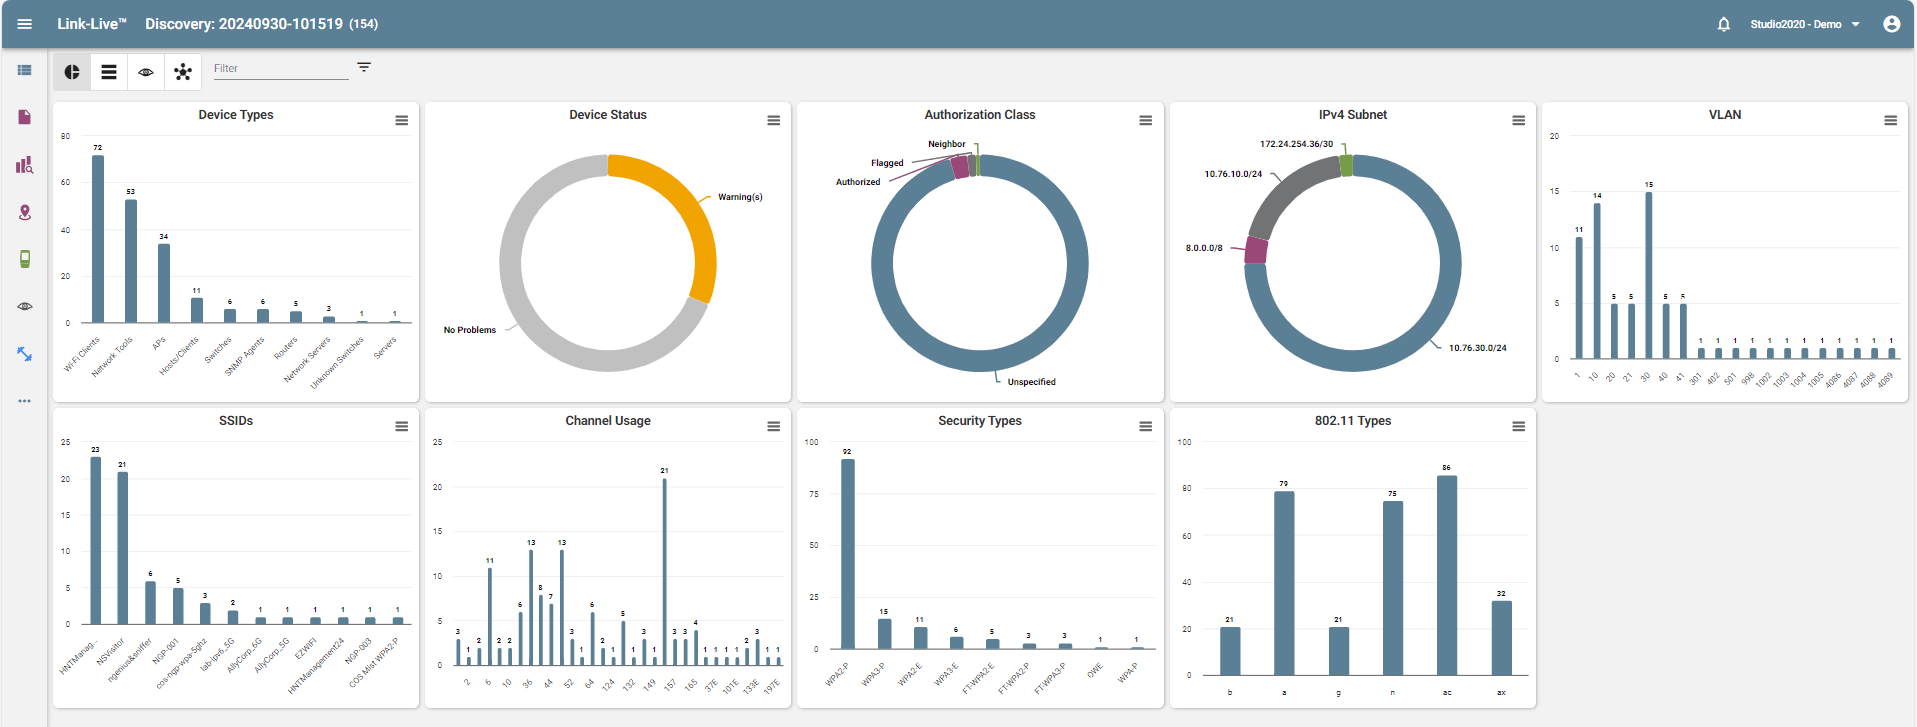
The heart of Link-Live’s ability to deliver comprehensive situational awareness is centered with its Discovery and WiFi dashboards. To see this in action, check out this short video which demonstrates the simple navigation and drill-down to resolution capabilities. For this blog, we’ll focus on key highlights.
Discovery Dashboard
Let’s start with the Discovery dashboard which includes four “modes” of methods of displaying the network status information. These are located at the upper left-hand side of each dashboard, where users can easily switch between these by clicking:
Each provides a distinct perspective of network security status, valuable for different audiences:
Graphical Mode – Excellent for providing a status summary. This is a dynamic, interactive graphical interface, rolling over each widgets provides instant visibility into each of the variables called out via fly-over values. Users can also drill-down as required for investigations. Among other situational awareness elements discussed above, “Infrastructure Integrity” can be quickly assessed from this angle.
Link-Live Discovery Dashboard – Graphical Mode
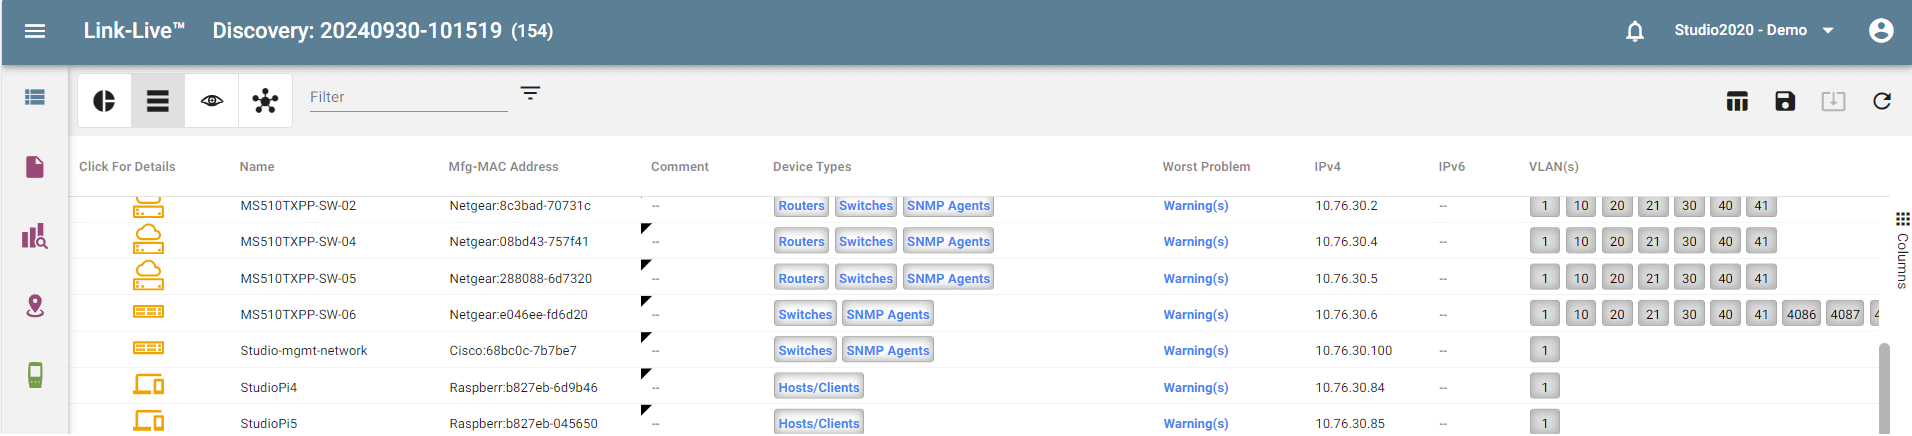
Tabular Mode – Provides a device-by-device breakout with key attributes, one per line across multiple columns. Included here is powerful free-string search and filtering by all network parameters listed such as device, VLAN, and security. Delivers insights into both “Device Health, Availability, and Status” and “Infrastructure Integrity” situational awareness elements.
Link-Live Discovery Dashboard – Tabular Mode
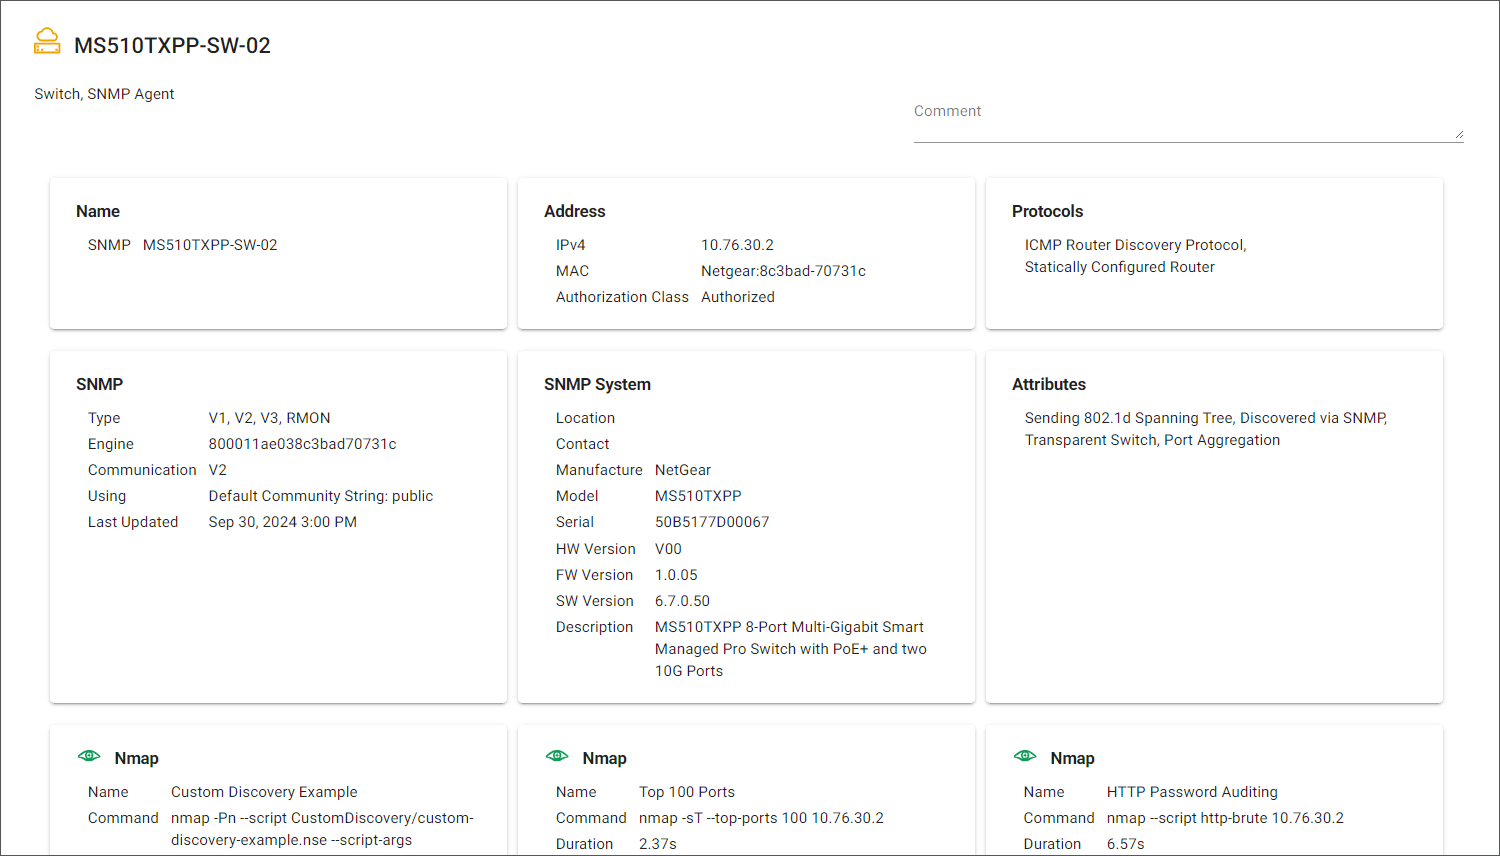
From this starting point, it is easy to select and drill into the questionable device for in-depth specifics into status and test results.
Link-Live Discovery Dashboard – Tabular Mode with drill-down into device status
Note filtering and searching is persistent across all four modes which makes workflow navigation a breeze.
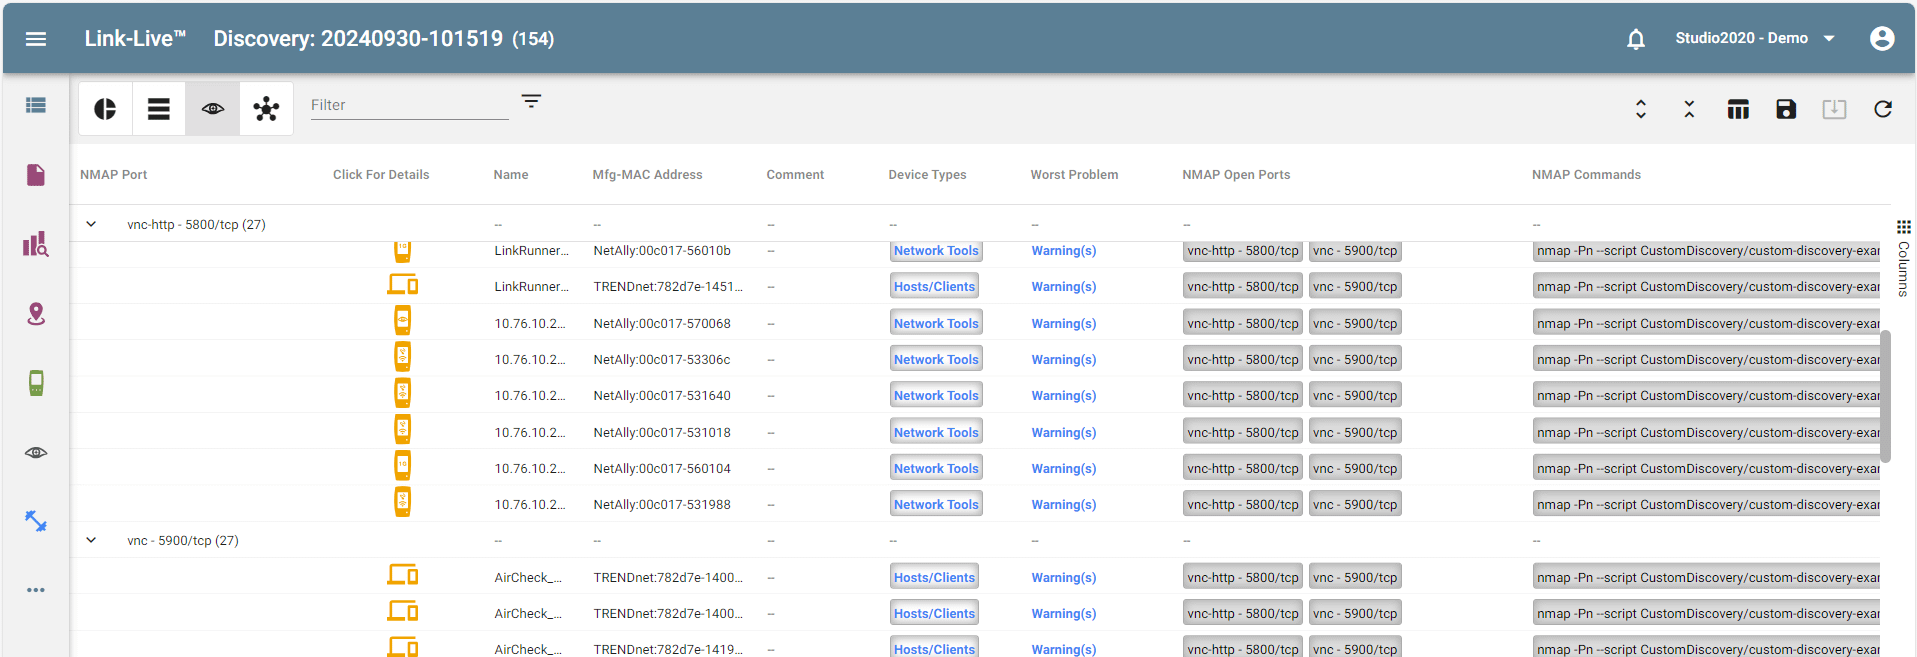
Nmap Mode – This viewpoint is available with CyberScope only and offers drill down overviews into specific Nmap commands and scripts executed during Discovery. Excellent for rapidly assessing “Threat Detection and Security Monitoring” elements of situational awareness.
Link-Live Discovery Dashboard – Nmap Mode
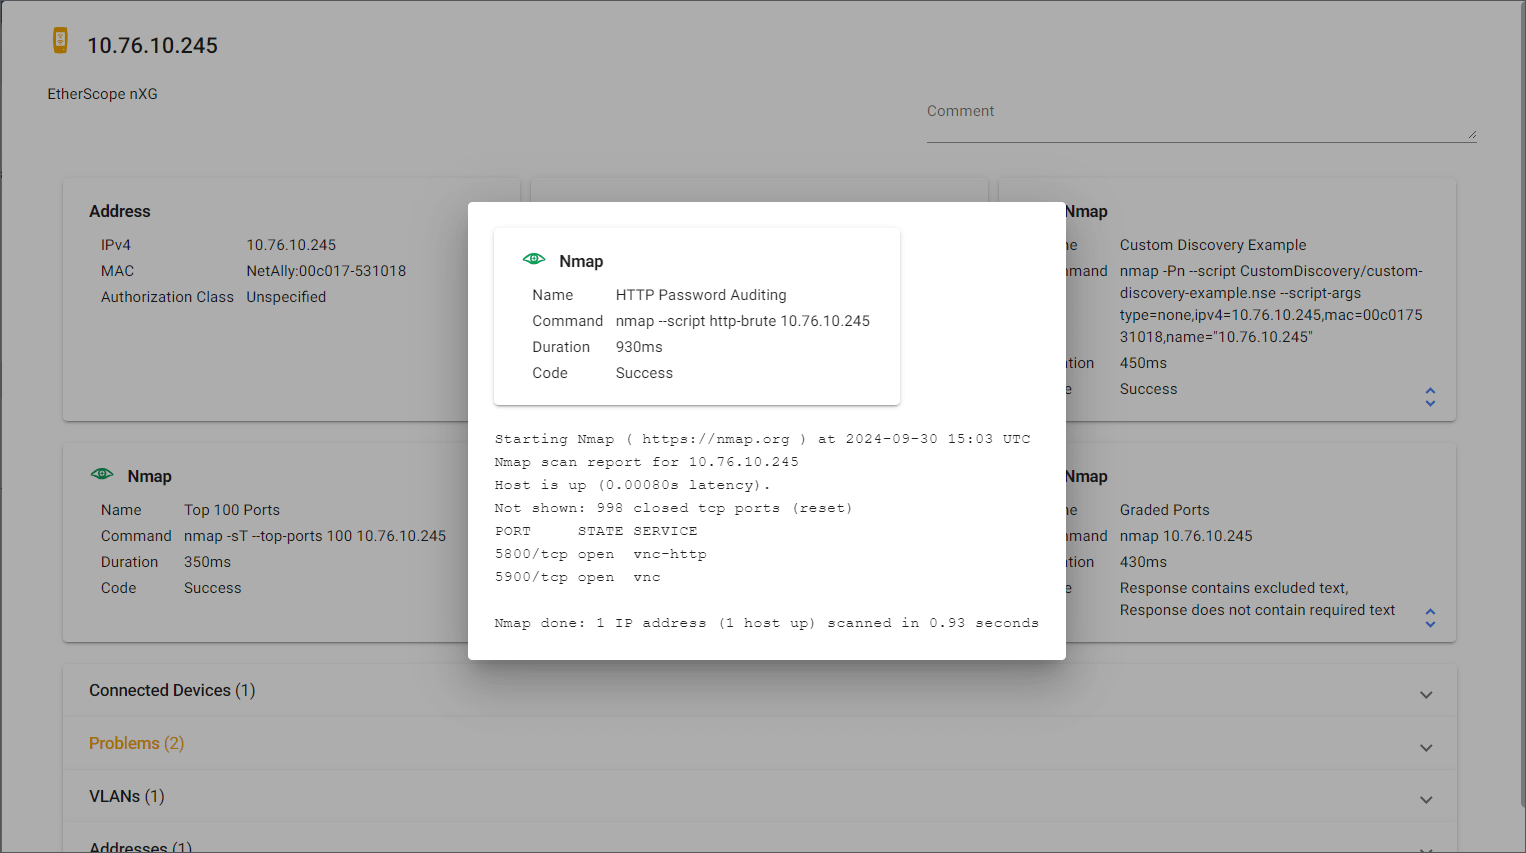
If required for security investigations, IT teams can drill into specific Nmap outputs
Link-Live Discovery Dashboard – Nmap Mode – Drill down into Nmap Output
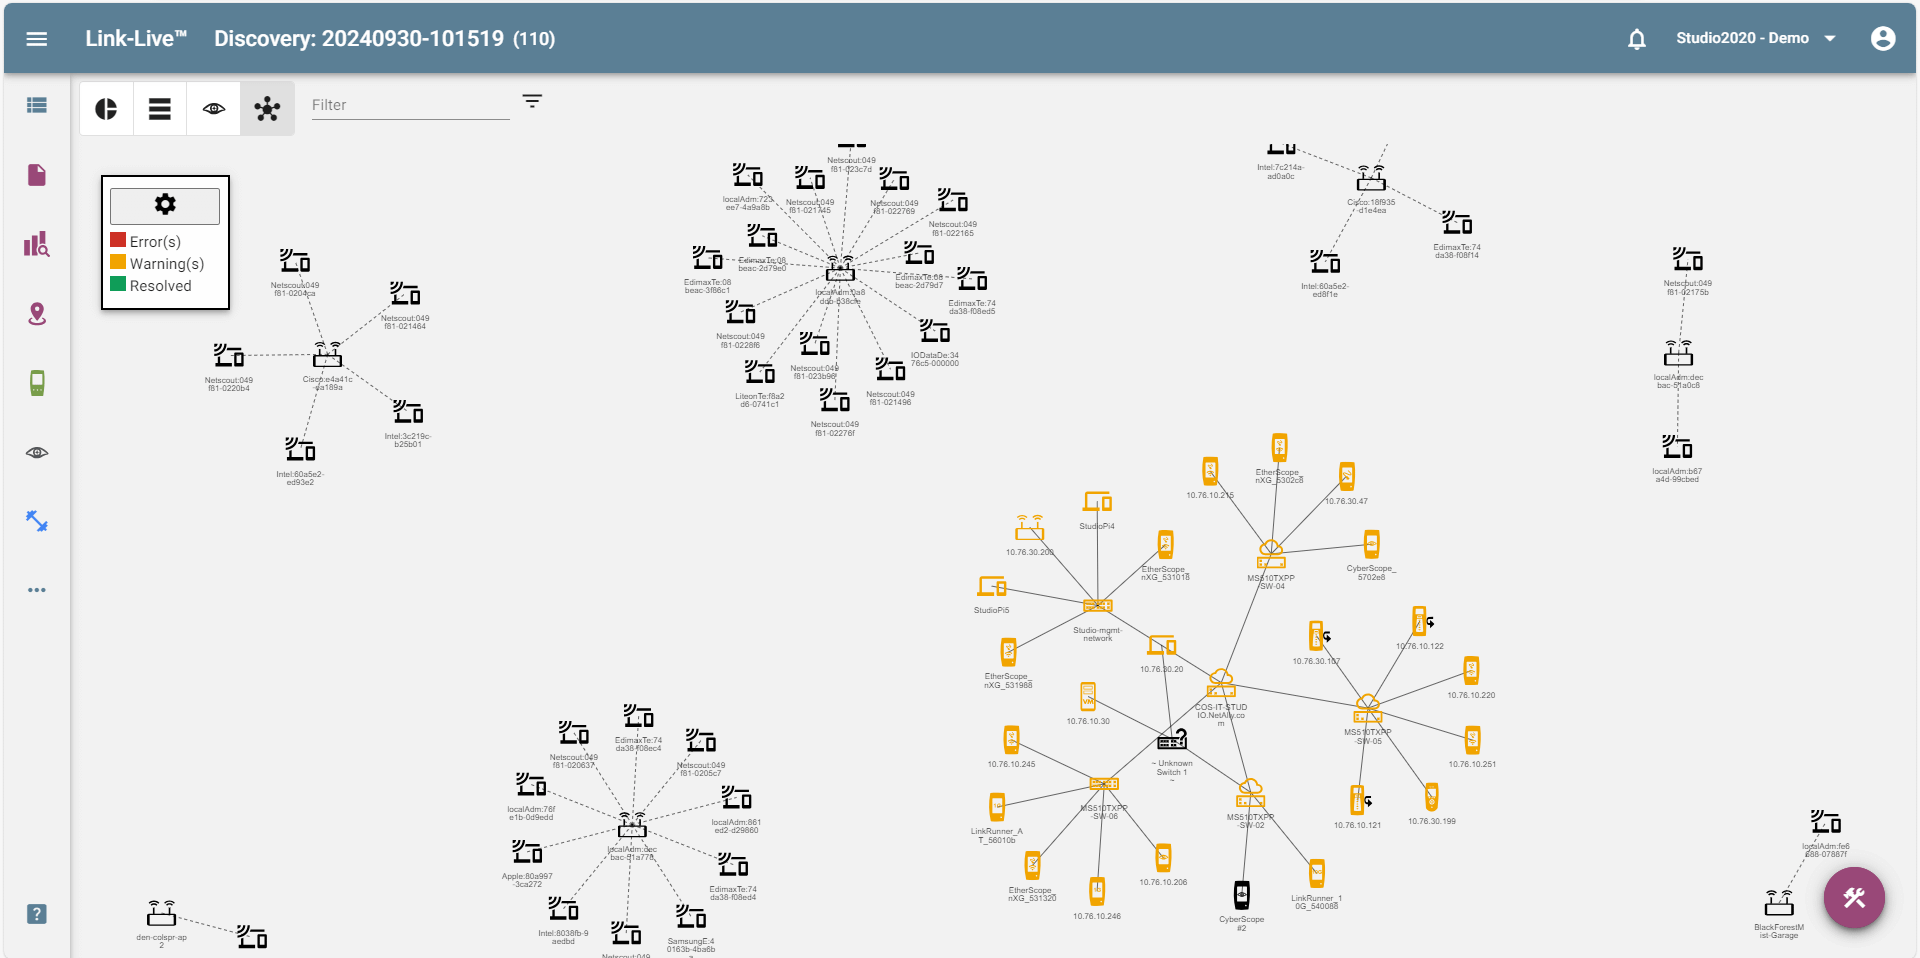
Topology Mode – Outstanding for providing a great visual way of seeing devices and their connectivity between each other. A perfect fit for the “Network Topology Intelligence” element of situational awareness.
Link-Live Discovery Dashboard – Topology Mode
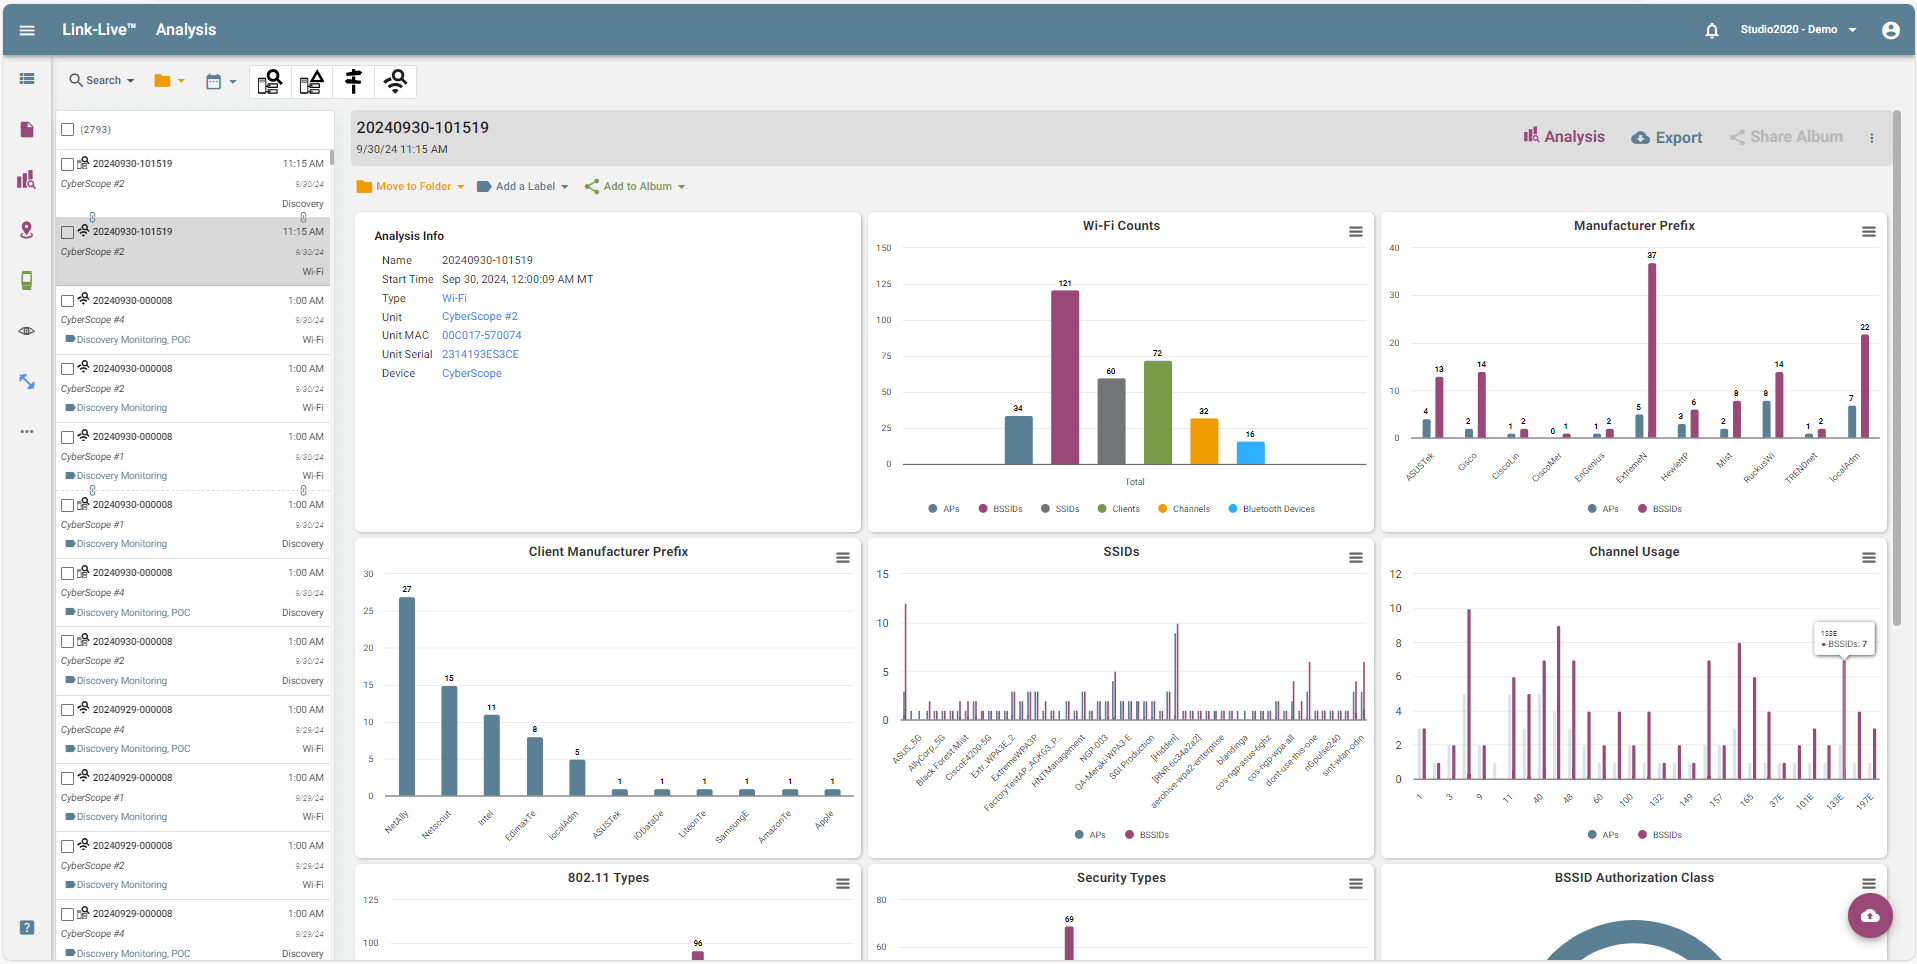
WiFi Dashboard
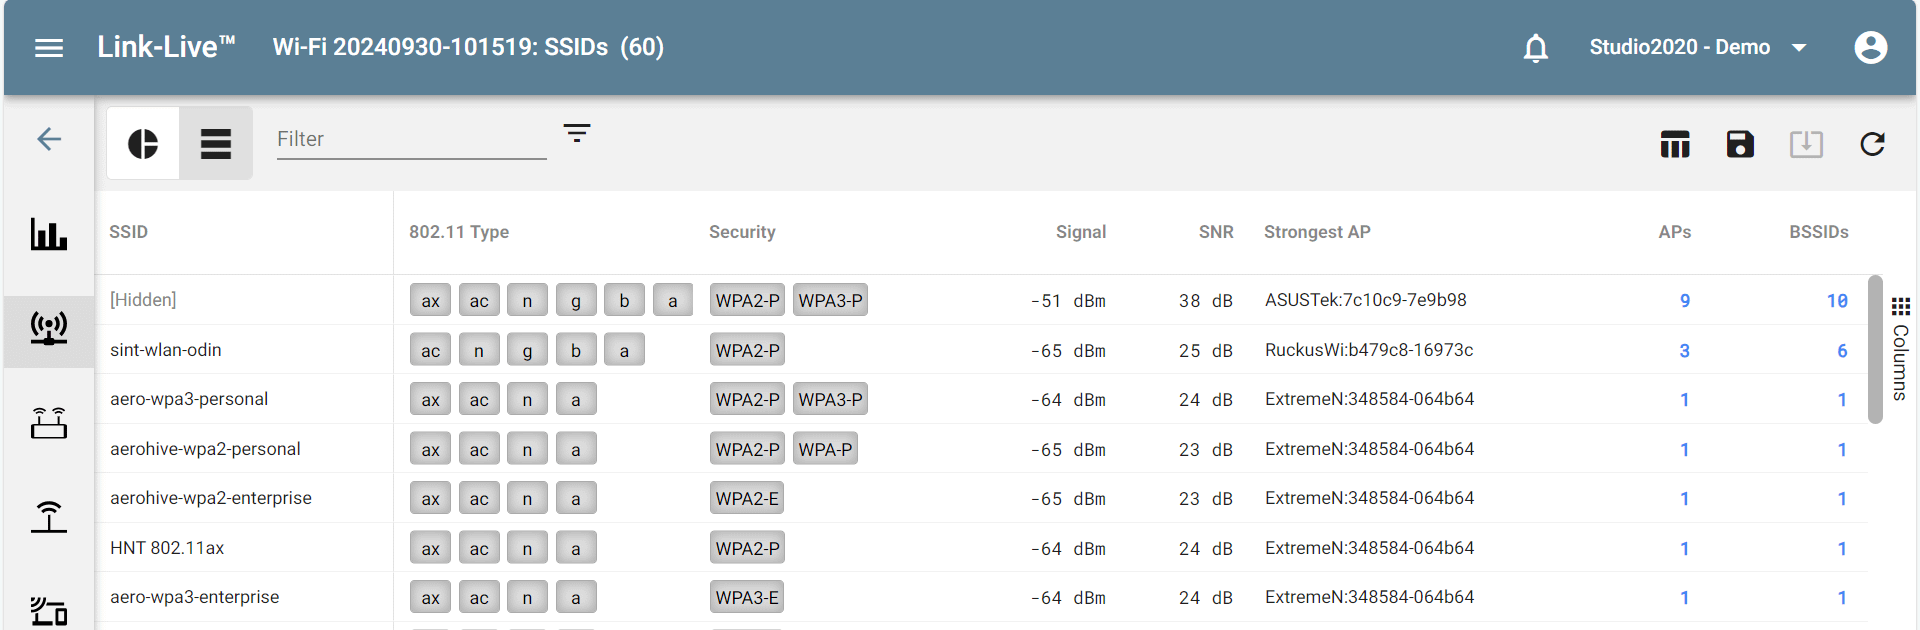
In this case, the dashboard summary includes widgets that call out Wi-Fi counts, manufacturer prefix, client manufacture prefix, SSIDs, channel usage, 802.11 types, security types, BSSID authorization class, and client authorization class. Everything one needs to quickly assess the status of the edge wireless network.
The second console is the WiFi dashboard. Generated as part of the discovery process, here the focus is on wireless, both WiFi and Bluetooth.
As with the Discovery dashboard above, this is a highly flexible, interactive graphical interface, rolling over each widgets provides instant visibility into each of the variables called out via fly-over values. Users can also drill-down as required for investigations. Wireless “Infrastructure Integrity” can be quickly assessed from this standpoint.
Link-Live WiFi Dashboard – Summary
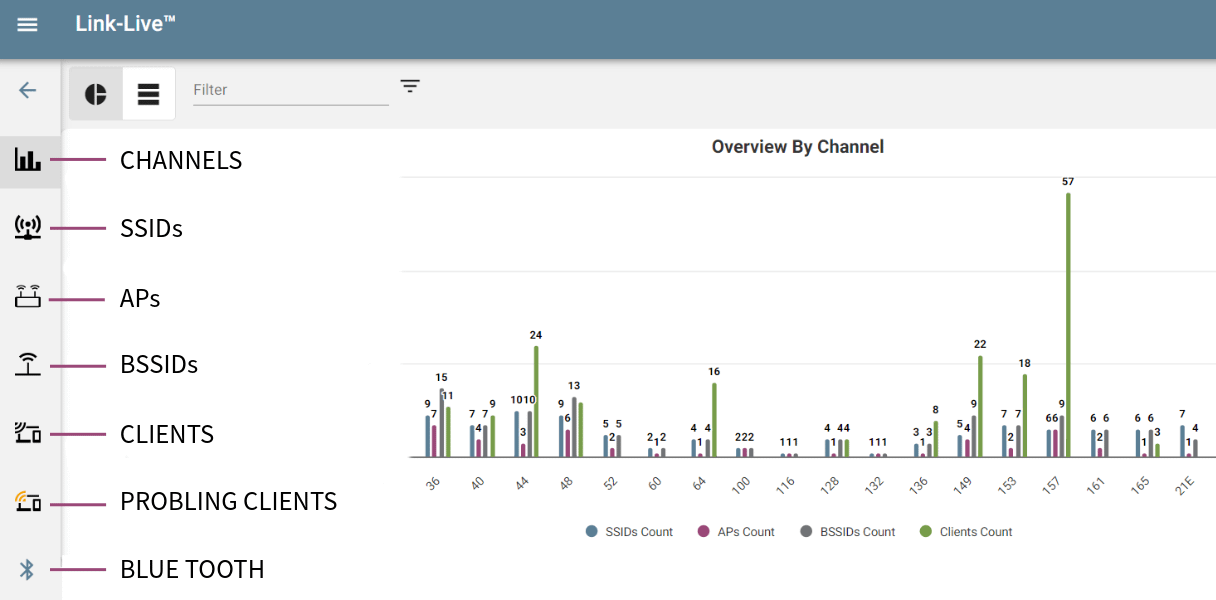
Navigating from the summary dashboard begins by clicking on the “Analysis” in the upper right corner. Two “modes” of assessing the data are then presented. These are located at the upper left-hand side of each dashboard, where users can easily switch between these two by clicking either the graph or tabular icon.
In conjunction with this there are six “Views” offered whether in Graph or Tabular mode: Channels, SSIDs, APs, BSSIDs, Clients, Probing Clients, and Bluetooth.
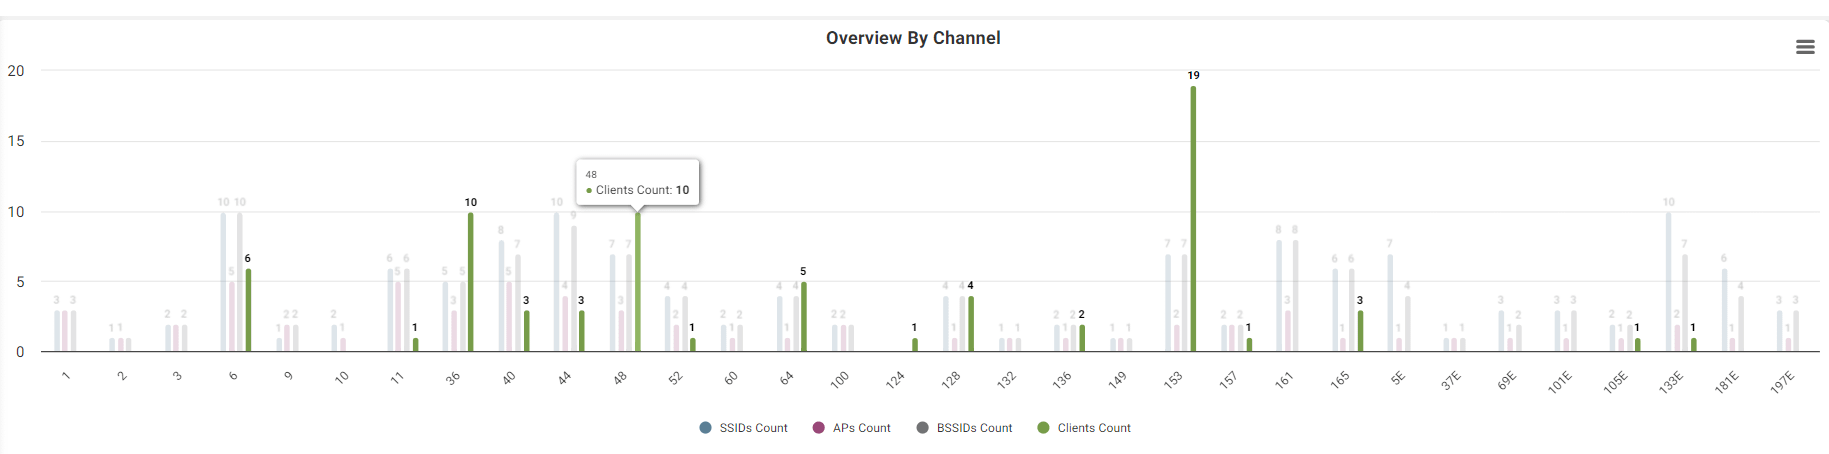
Graph Mode – Two widgets are shown, the first, “Overview By Channel” (this is the first “view”) gives a channel by channel count of SSIDs, APs, BSSIDs, and Clients. Displays details, depending on View into all situational awareness elements except “Network Topology Intelligence”.
As with all widgets, fly over functionality makes getting an instant readout or drill-down fast. With persistent filtering and search, users can switch between each of six views easily as well. As with Graph Mode, displays key facts—as a function of View—into all situational awareness elements except “Network Topology Intelligence”.
Link-Live WiFi Dashboard – Graph Mode – Overview by Channel View – Fly Over
Tabular Mode – In this example, “Overview By SSID” is shown (this is the second “view”) lists all SSIDs with relevant parameters in columns.
At the beginning of this blog, the claim was made that given the hectic environment at the edge, the need for comprehensive situational awareness was critical to ensuring optimal network performance and a robust cybersecurity posture. Busy IT Help desks suggest there is truth in this from a performance standpoint while I would argue the relentless stream of yet another organization announcing a security breach serves as strong evidence from a threat perspective.
Given these observations, one way out of this conundrum is to offer a single tool that lets both SecOps and NetOps (or those responsible whether one team/individual or multiple ones) have end-to-end, comprehensive network perimeter situational awareness—four of which were highlighted.
Using numerous screen captures, Link-Live was shown to be that one tool to deliver on this critical IT organizational need. With the ability to collect and share information across the entire business, Link-Live is the solution to address all the challenges at the edge, whether performance or security.
Tycom is a proud NetAlly partner. Many of our loyal clients work with Data Networks. Wireless LAN has it’s challenges but CyberSecurity is a real concern.
Maybe someone wasn’t happy with the Wi-Fi performance at the office (too slow!) and decided to connect an old home router to the network so they could get better connectivity. To simplify things they decided to leave security off (no encryption!). What could go wrong, right?
This could also just as well be a bad actor with the ability to circumvent your security protocols! Rogue or hidden access points are a risk!
No need to panic! Did you know that the “Locate tool” in NetAlly’s EtherScope® nXG, AirCheck® G3 and CyberScope® Air provides a quick and easy way to simplify the process of physically locating both AP and Client devices on the 2.4/5/6 GHz bands by measuring their signal strength. Using an optional directional antenna makes it easy to find unauthorized devices or locate APs that need to be replaced.
With powerful tools suited for wireless engineers, but ease of use for technicians and remote “smart hands”, NetAlly’s Wi-Fi analyzers make your entire team more productive.
Learn more about how to find hidden Wi-Fi devices in our videoand free application note.
Tycom is proud to partner with NetAlly. Many of our loyal clients work with Data Networks and that is why we would like to present NetAlly’s new LinkRunner AT range which will ultimately supersede the AT-2000 and AT-3000
LinkRunner, New Release From NetAlly. We don’t want to steel their thunder so please see the NetAlly news release at Next-Gen LinkRunner®
But we would like to give a short summary of what these two super new editions give you.
Tycom is a proud partner to Fluke! We had to share this article from Fluke with our clients:
Early reports from the field suggest that the new Fluke 772 and 773 Milliamp Process Clamp Meters may be game changers, breaking new ground for technicians in the HVAC controls industry. With the feature sets these meters offer, troubleshooting of the most common problems in modern control systems becomes a snap.
Common applications for these meters include communications measurement, milliamp loop sensor measurement, damper and valve actuator troubleshooting, and troubleshooting the operation of variable frequency drives (VFDs). Let’s look at some typical scenarios for each of these examples.
Communications measurement
A controls technician receives a too-hot complaint from a room on the third floor of a building on campus. A quick check of the BAS front-end computer reveals that the variable air volume (VAV) box controller is offline, not communicating. The technician grabs his new Fluke 773 and heads out to the building.
After reaching the room, a quick check of the VAV box in the ceiling reveals that the VAV damper is in the closed position. The VAV controller normally has an LED that blinks when the controller is online. That LED is off.
The technician quickly attaches his Fluke meter to the RS-485 Communication bus wiring terminals and measures the proper voltage, reading approximately +2.5 V dc between the three terminals, labeled +, – , and ref.
A quick check of the wiring shows that the communications connector was not fully seated, causing a communications loss.
After seating the connector properly, the VAV box controller comes back online, the communications LED resumes blinking, and the VAV damper begins to stroke open.
A call is then placed to the operator in the control room and the controller is now online. The room immediately begins to cool down.
Milliamp loop sensor measurement
The foundation of each model in the 771/772/773 Milliamp Clamp series is the groundbreaking ability to troubleshoot milliamp sensors inside crowded control panels – without breaking the circuit. In this scenario, our technician notices that the static pressure inside the supply duct of a VAV system seems to be too high.
A check of the BAS front-end computer indicates that the sensor is reading a perfect 1″ WC of static pressure.A check of the actual static pressure using an airflow meter such as the Fluke 922 indicates that the static pressure is actually 1.5″ WC. For these systems, 1′ WC is considered normal.
The technician takes his 773 Milliamp Clamp out to the control panel and finds the wires that terminate the static pressure sensor to the controller. As in many of the control panels in this building, the wiring looks like cooked spaghetti. The small jaws of the 772/773 enable the technician to clamp the exact wires perfectly. He reads the milliamp signal and compares it to the listed range for the sensor. The sensor is 0 – 20 mA and has a range of 0 – 2″ WC. It is currently reading 15 mA. At 1″ WC it should be reading 10 mA.
The technician uses his laptop and opens up the program in the controller. He finds that the programmer did not scale the sensor properly in the software, which caused the error.
Damper and actuator troubleshooting
Another controls technician receives a too-cold complaint from an office in the building. The system is VAV with a hot water reheat valve.
A quick look determines that the valve is closed. She connects her laptop to the controller and uses it to commission the controller. She attempts to override the valve open, but without success.
She disconnects the wires to the actuator from the controller and then connects to the Fluke 773. She uses the meter to send a 0 – 10 V dc signal directly to the valve actuator to make it open and close. The valve actuator then works perfectly.
Reviewing the controller programming, the tech determines that the reheat valve was forced closed by an improperly operating interlock, which is then removed. After this, the reheat valve works properly and the space warms up.
Troubleshooting VFDs.
During a spell of hot weather, all the occupants of a building complain that it is too hot.
The chilled water pump system uses a VFD, but its operating pressure is too low.
The controller sends a milliamp signal to the drive to command it to the correct frequency to obtain the correct system pressure. A tech disconnects the system controller, connects the Fluke 773 directly to the terminal block of the VFD, and generates a milliamp signal to the drive to increase the speed. Despite generating a 100% signal to the drive, it never comes up to speed.
A check of the recorded fault statuses of the drive indicates that a circuit board has failed. The manufacturer is contacted and the faulty board replaced, at which time the drive operates correctly again and the chilled water system returns to the correct pressure.
In these common scenarios, the Fluke 772 and 773 meters are already proving themselves in the wide range of troubleshooting situations encountered in today’s buildings. Every controls technician will want one in their tool bag.
Tycom is a proud partner to Fluke! We had to share this article to our clients with a few changes to relate to South Africa’s situation:
Globally & very definitely South Africa, solar installations (also known as photovoltaic or PV installations) are continuing to multiply rapidly, driven by compelling economics for utility-scale solar generation and efforts to decarbonize the grid (and our continuing load shedding). As solar distribution systems and loads become larger and more complex, the possibilities of transient overvoltages increase — and the implications for safety become more important than ever.
When you’re taking measurements on solar installations, these transients are invisible and largely unavoidable hazards, which means that your protection depends on the safety margins already built into your tools. That’s where the Measurement Category Rating comes in: it’s designed to tell the user which types of electrical installations the measurement device may safely make measurements in.
A voltage rating alone, however, won’t tell you how well a handheld tool was designed to survive high transient impulses — its category rating also must fit the environment you’re working on.
What to know about overvoltage category ratings
Standards that define measurement category ratings are all about safety. Safety standards for measurement equipment are set by the International Electrotechnical Commission (IEC) to ensure that the instrument and operator are never the weak link in the system — and subsequently the location of failure — if a voltage transient occurs. The measurement categories are defined below.
Measurement Category
Examples
CAT IV
Refers to the “origin of installation,” i.e., where low-voltage connection is made to utility power
Outside and service entrance, service drop from pole to building, run between meter and panel
Overhead line to detached building, underground line to well pump
CAT III
Equipment in fixed installations, such as switchgear and polyphase motors
Photovoltaic installations
Buss and feeder in industrial plants
Feeders and short branch circuits, distribution panel devices
Single-phase commercial lighting systems
Appliance outlets with short connections to service entrance
CAT II
Appliances, portable tools, and other household and similar loads
Outlet and long branch circuits
Outlets at more than 10 m (30 ft) from CAT III source
Outlets at more than 20 m (60 ft) from CAT IV source
IEC 61010 measurement categories apply to test equipment for <3000 V mains measurements and correspond to the overvoltage category definitions and transient protection defined for mains installations from IEC 60664.
The division of a power distribution system into categories is based on the fact that a dangerous high-energy transient, such as a lightning strike or switching transient, will be attenuated or dampened as it travels through the impedance (ac resistance) of the system. The higher the category, the larger the prospective fault current available and the higher the voltage transients can be — peaking as high as 10,000 V for mains being measured at CAT III < 1500 V.
Solar installations are Category III environments
IEC 61730-1 defines PV modules as permanently wired electrical installations (Category III), not point-of-use electrical outlets (Category II).
Overvoltage categories in a photovoltaic installation connected to the utility energy grid
In addition to being tested to an actual overvoltage transient value, handheld measurement tools are required to have a minimum insulation level — a combination of solid insulation, clearance, and creepage — between internal components and circuit nodes to meet the category rating. Insulation protects internal circuits against fire/arc fault and the operator against electric shock. The higher the working voltage and measurement category rating, the greater the insulation required.
Within a category, a higher voltage rating denotes a higher transient withstand rating. For example, a CAT III 1500 V meter is resistant to much higher energy transients, and therefore offers superior protection compared to one rated CAT III 1000 V.
Solar installation voltage is increasing
Overvoltage category III 1500 V systems are becoming the new normal in solar, delivering cost savings and efficiency gains to facility owners. Each inverter can process more energy, more panels can be connected in series to make longer strings, which requires fewer wires and inverters.
For safety and accuracy, making measurements in an overvoltage category III environment requires CAT III rated tools.
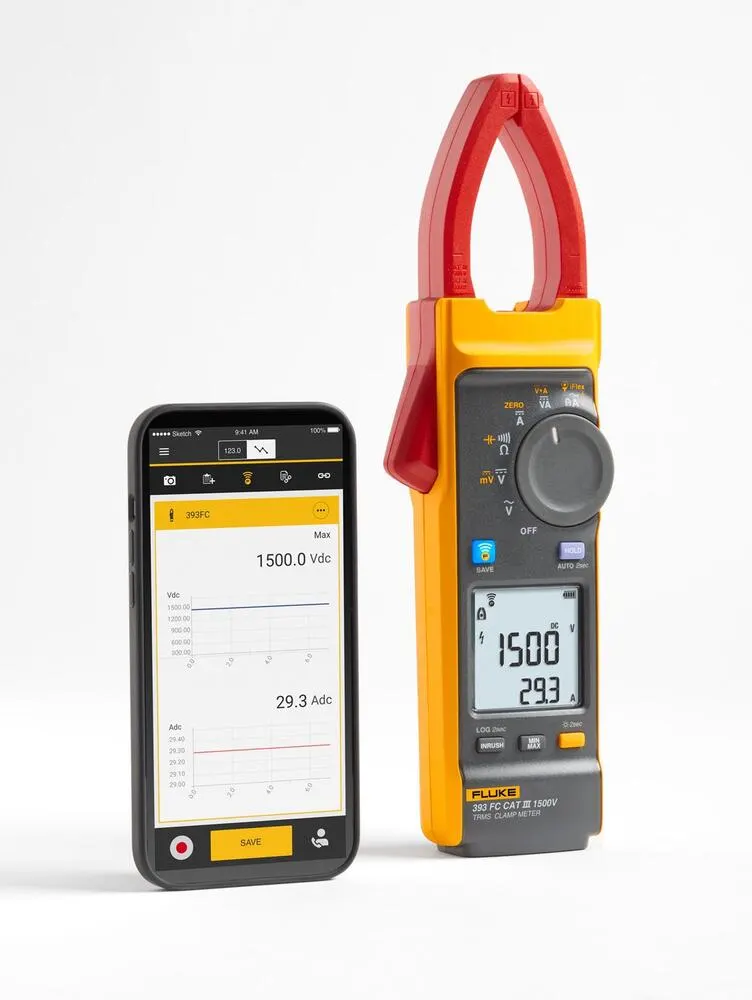
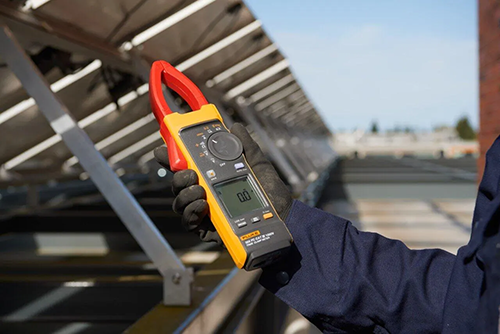
The Fluke 393 FC Solar Clamp Meter is the only CAT III 1500 V/CAT IV 600 V TRMS Clamp Meter which meets the insulation requirements for CAT III environments like solar installations and measures up to 1500 V dc.
The dielectric tests for a CAT III 1000 V current clamp is 8000 V pk/7000 V rms. For CAT III 1500 V, it’s 10000 V pk/9700 V rms.
The Fluke 393 FC CAT III 1500 V TRMS Clamp Meter is the world’s only CAT III rated clamp meter adequately rated for use in 1500 V PV installations.
When choosing measurement tools for PV panels, it’s worth considering the worst-case scenario of the job. First, choose a meter rated for the highest category you could be working in. Then, look for a voltage rating that matches your needs. Choosing the right CAT rated tool for your environment helps you and your team make reliable measurements while reducing risk.
The 393 FC meets the safety requirements for test equipment (IEC 61010-2-032) corresponding to the overvoltage category level of the PV array electrical installation (IEC 61730-1). It offers safe and accurate voltage measurement up to 1500 V dc in solar and battery applications, with features that help make the job easier:
25% thinner jaw (compared to Fluke 37x meters) makes it easier and faster to take measurements in tight and overcrowded spaces
IP 54 protection for dusty and rainy outdoor conditions
Fluke Connect™ gathers and stores data in the cloud for access anywhere
Includes CAT III 1500 V insulated test leads
Carries the Fluke promise of proven safety, ruggedness, and reliability
Why use a CAT III rated tool in solar installations? It comes down to safety: yours. Don’t entrust your protection (or your team’s) to any tool that’s not adequately rated for the job.
We use cookies on our website to give you the most relevant experience by remembering your preferences and repeat visits. By clicking “Accept All”, you consent to the use of ALL the cookies. However, you may visit "Cookie Settings" to provide a controlled consent.
This website uses cookies to improve your experience while you navigate through the website. Out of these, the cookies that are categorized as necessary are stored on your browser as they are essential for the working of basic functionalities of the website. We also use third-party cookies that help us analyze and understand how you use this website. These cookies will be stored in your browser only with your consent. You also have the option to opt-out of these cookies. But opting out of some of these cookies may affect your browsing experience.
Necessary cookies are absolutely essential for the website to function properly. These cookies ensure basic functionalities and security features of the website, anonymously.
Cookie
Duration
Description
cookielawinfo-checkbox-analytics
11 months
This cookie is set by GDPR Cookie Consent plugin. The cookie is used to store the user consent for the cookies in the category "Analytics".
cookielawinfo-checkbox-functional
11 months
The cookie is set by GDPR cookie consent to record the user consent for the cookies in the category "Functional".
cookielawinfo-checkbox-necessary
11 months
This cookie is set by GDPR Cookie Consent plugin. The cookies is used to store the user consent for the cookies in the category "Necessary".
cookielawinfo-checkbox-others
11 months
This cookie is set by GDPR Cookie Consent plugin. The cookie is used to store the user consent for the cookies in the category "Other.
cookielawinfo-checkbox-performance
11 months
This cookie is set by GDPR Cookie Consent plugin. The cookie is used to store the user consent for the cookies in the category "Performance".
viewed_cookie_policy
11 months
The cookie is set by the GDPR Cookie Consent plugin and is used to store whether or not user has consented to the use of cookies. It does not store any personal data.
Functional cookies help to perform certain functionalities like sharing the content of the website on social media platforms, collect feedbacks, and other third-party features.
Performance cookies are used to understand and analyze the key performance indexes of the website which helps in delivering a better user experience for the visitors.
Analytical cookies are used to understand how visitors interact with the website. These cookies help provide information on metrics the number of visitors, bounce rate, traffic source, etc.
Advertisement cookies are used to provide visitors with relevant ads and marketing campaigns. These cookies track visitors across websites and collect information to provide customized ads.